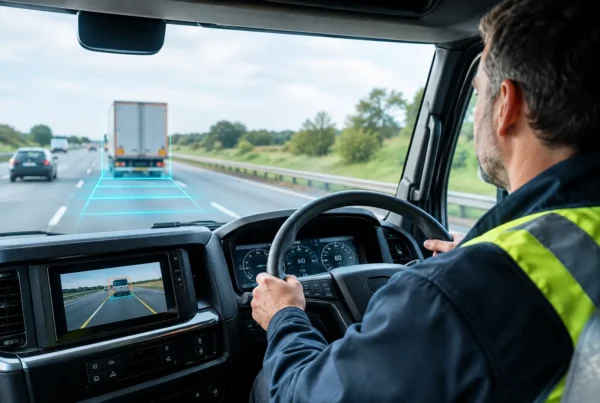

A fleet utilisation improvement example is most useful when it moves beyond vehicle tracking and shows a clear operational result. For a field-service fleet, the issue is rarely that every vehicle is standing still. More often, some drivers are overloaded, others have gaps between jobs, and the office has no reliable view of where capacity is being lost.
That creates avoidable cost in fuel, overtime, vehicle wear and missed customer commitments. It can also prompt the wrong investment decision: adding another van when the existing fleet could complete more work with better planning and live visibility.
A practical fleet utilisation improvement example
Consider a UK property maintenance business operating 24 vans across three depots. Its engineers handle reactive repairs and planned inspections for commercial sites. The fleet manager believes the business is short of vehicles because jobs are regularly pushed into the following day and drivers are claiming overtime.
A closer review tells a different story. Vehicle tracking data shows that average daily mileage is reasonable, but utilisation is uneven. Several vans spend long periods parked between appointments, while engineers from another depot travel across the same area to attend urgent work. Planners are allocating jobs from a spreadsheet and relying on drivers to call in when they become available.
The business sets a straightforward objective: increase productive time per vehicle without extending working hours or pressuring drivers into unsafe behaviour. It introduces live fleet visibility, planned-versus-actual journey reporting and a dashboard that compares job attendance, parked time, travel time and mileage by depot.
Over an eight-week review period, the data identifies three recurring problems. First, jobs are being assigned according to the engineer who is normally responsible for a customer, rather than the closest suitably qualified person. Secondly, the team has no alert when a vehicle remains at an unplanned location for longer than expected. Thirdly, planners cannot see that a job has overrun until the driver makes contact.
The operational response is not complicated. The business keeps customer continuity where it matters, but permits planners to reassign urgent work to the nearest qualified engineer. It creates alerts for excessive idle time and unplanned stops, with sensible thresholds that account for breaks, site access and loading. It also gives planners a live map and status view so they can make decisions before delays build up.
By the end of the trial, completed jobs rise from an average of 5.8 to 6.5 per van per day. The business removes most of the backlog without buying the two additional vans it had budgeted for. Overtime falls because work is spread more evenly, while customers receive more accurate arrival updates when a visit is delayed.
The gain did not come from asking drivers to work faster. It came from using the available fleet more intelligently.
Measure utilisation properly before trying to improve it
Utilisation is often reduced to miles travelled or hours on the road. Both measures have value, but neither shows whether a vehicle is supporting productive work. A van travelling 180 miles may be covering an inefficient route; a van parked for an hour may be at a customer site completing a valuable job.
The right definition depends on the operation. A delivery fleet may focus on drops per vehicle, route completion and loading time. A service business may give greater weight to attended appointments, travel between jobs and first-time fix rates. A construction or facilities team may need to distinguish between asset deployment, engine run time and time spent available but unused.
Before setting a target, establish a baseline across at least four weeks. Look at:
- productive jobs or deliveries completed per vehicle;
- travel time and distance between assignments;
- planned versus actual route and appointment timings;
- parked, idling and unauthorised-use time; and
- overtime, subcontractor spend and vehicles unavailable through maintenance.
These figures should be viewed together. A sharp rise in jobs per van is not a success if missed breaks, speeding events, vehicle defects or customer complaints rise at the same time. Better utilisation must support safe, compliant and sustainable operation.
Turn visibility into better daily decisions
A live map is valuable when it answers a practical question: who can take the next job, and can they do so without compromising service or compliance? The fleet manager should not need to chase drivers for location updates or ask planners to reconcile several systems before reallocating work.
For the maintenance business, live visibility allowed planners to allocate nearby urgent jobs to engineers who had finished early. Geofences at regular customer sites automatically recorded arrival and departure times, reducing manual admin and giving the customer service team reliable information. The organisation could also see whether a reported delay was caused by traffic, a lengthy job, an unexpected detour or a scheduling error.
This is where tailored dashboards matter. An operations director may need a depot-level view of capacity, outstanding work and overtime. A fleet manager may need exceptions such as excessive idling, vehicle downtime and out-of-hours journeys. A supervisor may only need to know which qualified engineer is closest to a priority call-out. Giving each person the same mass of data usually creates more work, not better control.
Address the causes, not just the symptoms
Low utilisation is not always a routing issue. It can result from poor job information, missed parts, uneven skill coverage, access restrictions, vehicle downtime or customer appointment windows. Telematics provides evidence, but it should be tested against what drivers and planners experience on the ground.
In the example above, the data showed repeated journeys back to depot during the day. Driver discussions revealed the reason: engineers were collecting parts because job descriptions did not consistently state what was required. That was a planning and stock-control issue, not a driver performance problem. Updating job templates and holding a small range of common parts on selected vans reduced these return journeys.
There are trade-offs. Assigning the nearest vehicle can reduce travel, but it may weaken customer relationships if the assigned engineer lacks site knowledge. Tighter route planning may improve mileage but leave too little contingency for traffic, emergency work or legally required breaks. A good utilisation programme sets rules for when efficiency should give way to skill, safety or service quality.
Use driver data fairly and constructively
Drivers will support fleet technology when its purpose is clear and the information is used fairly. If tracking is introduced purely as a disciplinary tool, teams may become reluctant to report genuine problems or explain delays. If it helps remove unnecessary journeys, improves job allocation and provides evidence when a customer disputes an attendance time, it has a far more credible role.
Managers should agree what constitutes an exception, account for the realities of each role and review patterns rather than isolated events. Vehicle camera footage can add useful context after an incident or complaint, while driver behaviour reporting can identify fuel-wasting habits such as prolonged idling or harsh acceleration. Neither should be treated as a substitute for good supervision, clear policies and driver engagement.
The maintenance business shared weekly depot reports with team leaders and used them to recognise improvements as well as address problems. That helped establish that the programme was about reducing wasted time, not monitoring every minute of the day.
Prove the financial case
The financial case for higher utilisation should include more than fuel savings. In this scenario, avoiding two additional vans removed purchase or lease cost, insurance, road tax, maintenance and the administrative burden of adding assets. Lower overtime and fewer unnecessary miles created further savings, while faster response times helped protect contract performance and customer retention.
A credible business case separates hard savings from capacity gains. If the fleet completes more jobs with the same resources, calculate whether that means reduced subcontractor cost, additional billable work or fewer missed service-level targets. If vehicles are retained rather than replaced, be clear whether that is a cash saving now or an avoided future cost.
Fleet Software Solutions can support this process by matching tracking, camera and reporting technology to the way a business actually operates, then helping turn the resulting data into practical action. The best system is not necessarily the one with the longest feature list. It is the one that gives managers dependable evidence and makes day-to-day decisions easier.
The most useful next step is to choose one depot, one operating problem and a small set of measures that everyone understands. Prove where time and mileage are being lost, involve the people doing the work, and improve the process before adding more vehicles.