
A telematics fuel savings example is most useful when it starts with the numbers a fleet is already carrying: litres bought, miles travelled, vehicles off the road and time spent chasing explanations. For a busy UK service fleet, fuel is rarely wasted through one dramatic failure. It leaks away through avoidable idling, inefficient routes, speeding, harsh acceleration and mileage that nobody has challenged.
The following example shows how a 20-van field service operation could turn vehicle data into a measurable fuel reduction. The figures are illustrative, but the method is the same whether you operate ten vans, 100 cars or a mixed fleet of vehicles and plant.
The telematics fuel savings example: a 20-van service fleet
Consider a business operating 20 diesel vans across several UK locations. Each vehicle covers around 25,000 miles a year, creating annual fleet mileage of 500,000 miles. The vans average 28mpg in real-world operation, rather than their brochure figure, and diesel costs £1.48 per litre.
At that consumption level, the fleet uses approximately 81,200 litres of fuel each year. Its annual fuel bill is therefore about £120,200.
That is the baseline. Before setting targets or coaching drivers, the fleet manager needs confidence in these figures. Telematics can validate recorded mileage, identify missed fuel-card transactions, separate business and private mileage where policy allows, and show whether vehicles are being used as planned. A fuel saving target based on unreliable data will quickly lose credibility with drivers and finance teams.
The manager installs vehicle tracking with driver identification, configurable behaviour alerts and weekly exception reporting. The aim is not to monitor every movement for its own sake. It is to find the repeatable operating habits that consume fuel without improving customer service.
Where the fuel saving comes from
After four weeks of baseline reporting, the data highlights four areas. The important point is that these are not treated as four separate savings that can simply be added together. Route choice, idling and driving style often overlap. The fleet team uses them to target interventions, then measures the actual reduction in fuel used per mile across the whole fleet.
Excessive idling at jobs and depots
Several vans are idling for extended periods during morning loading, at customer sites and while drivers complete paperwork. Some idling is operationally necessary. Refrigerated vehicles, severe weather conditions and certain equipment requirements can limit what is achievable. But a vehicle running for ten or fifteen minutes while a driver is inside a site is avoidable.
The fleet sets an alert for idling beyond a sensible threshold, with different rules for different vehicle types. Depot supervisors receive a weekly report showing recurring locations and vehicles, rather than a stream of alerts that nobody has time to act on.
The target is a 60% reduction in avoidable idle time. For this fleet, that contributes an estimated 2.7% reduction in annual fuel spend, worth roughly £3,245.
Speeding and inefficient driving behaviour
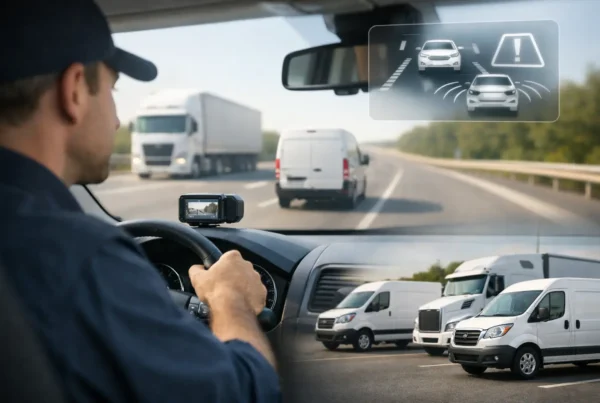
The reports also show regular speeding on faster roads, together with harsh acceleration and sharp braking in urban areas. These behaviours increase fuel consumption, but the cost is not only at the pump. They can also contribute to tyre wear, brake wear, collision risk and a less professional customer-facing presence.
A practical response is a short driver debrief based on clear events and journey context. A single harsh-braking event caused by a pedestrian or another road user is not a performance issue. A repeated pattern on the same journeys is worth addressing. Managers should use telematics data to have a fair conversation, not to create a league table that drivers will distrust.
Following driver coaching and a clear speeding policy, the fleet aims to recover 2.25% of its fuel spend, or around £2,704 a year. That assumes behaviour improves but does not become perfect, which is a more realistic planning assumption.
Poor route allocation and unnecessary mileage
The live map and journey history reveal that work is not always assigned to the nearest suitable driver. Vans occasionally pass each other on opposite directions of the same route, and last-minute jobs are allocated based on who answers the phone rather than location, skills and available capacity.
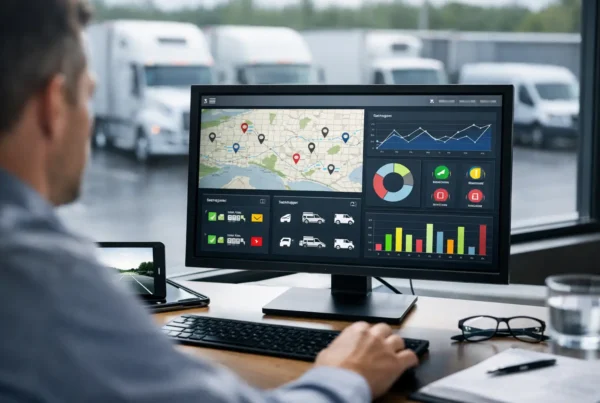
Telematics cannot fix weak scheduling on its own. It does, however, give operations teams the evidence to change it. Dispatchers can see who is genuinely nearby, whether a vehicle is delayed at a job, and whether a customer appointment can be grouped with another visit in the same area.
The business does not expect every journey to become shorter. Customer commitments, emergency call-outs and traffic disruption will always affect the day. It targets a 35% reduction in identified avoidable mileage, equivalent to a 1.58% fleet fuel saving or approximately £1,899 per year.
Unauthorised or unexplained journeys
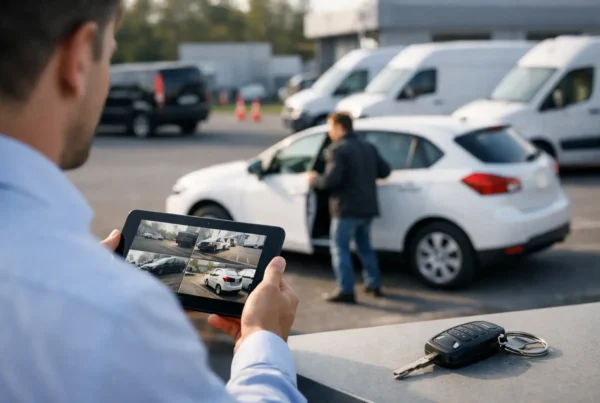
Finally, the fleet finds a small amount of mileage outside normal working patterns. Not every out-of-hours journey is misuse. Some drivers take vans home under an agreed arrangement, while others may need to respond to urgent jobs. The issue is that the arrangement has not been consistently recorded or reviewed.
Using geofence alerts around depots and home locations, alongside a clear vehicle-use policy, allows the manager to distinguish authorised activity from journeys requiring a conversation. Reducing unexplained mileage is estimated to save a further 0.94%, or around £1,130 a year.
The financial result
Once the changes have had time to settle, the fleet compares fuel used per mile over a three-month period with the same season in the previous year. It adjusts for major changes in workload, vehicle numbers and fuel prices. This avoids claiming a telematics benefit that was actually caused by a quieter trading period.
The combined, verified reduction is 7.5% rather than the theoretical total of every opportunity identified. On an annual fuel bill of £120,200, that is approximately £9,015 saved. Fuel consumption falls by about 6,090 litres a year.
Assume the telematics solution costs £18 per vehicle per month, with a £72 installation cost per vehicle. For 20 vehicles, first-year costs are £5,760: £4,320 for the service and £1,440 for installation. The first-year net fuel benefit is therefore around £3,255, with payback in roughly eight months. In subsequent years, when installation costs no longer apply, the annual net fuel benefit rises to about £4,695.
This calculation deliberately excludes potential savings from fewer collisions, reduced maintenance, improved attendance visibility, better customer updates and lower insurance costs. Those benefits may be significant, particularly where vehicle cameras and driver risk management are included, but they should not be used to inflate a fuel-only business case.
What makes the result credible
A credible telematics business case is built around behaviour change, not just a tracking screen. If a fleet manager receives an idling report but has no process for reviewing it, explaining the standard and following up, fuel use is unlikely to move for long.
The strongest programmes give managers a small number of meaningful measures: fuel used per mile, idle time, speeding duration, avoidable mileage and exceptions by depot or team. They also account for operational reality. A highways maintenance fleet, for example, will have different idling and route requirements from a planned-installation business.
Driver engagement matters as well. Explain that the purpose is safer, more efficient work and fair evidence when incidents or customer queries arise. Share fleet-level progress, recognise improvement and make sure reports are accurate before challenging an individual. Poor-quality data or inconsistent rules will undermine the programme quickly.
Turning data into a practical fuel plan
Start with a baseline of at least four weeks, preferably covering a representative working period. Then set one or two achievable priorities rather than asking drivers and managers to change everything at once. Idling and avoidable mileage are often good starting points because the evidence is straightforward and the operational conversations are practical.
Review results monthly, comparing litres per mile alongside total spend. Total fuel cost can rise even when a fleet becomes more efficient if workload has increased or pump prices have moved. Normalising the data protects the integrity of the result.
Fleet Software Solutions can help operators select compatible tracking technology, configure useful alerts and shape reporting around the measures that matter to their operation. The real value comes when the information is translated into actions that managers can sustain without adding unnecessary administration.
Fuel savings are rarely a one-off win. They become a controllable operating cost when the fleet can see what is happening on the road, act on the exceptions that matter and prove that each improvement is delivering value.